
Omnichannel retailers use stores as their order fulfillment locations. Fulfillment centers help merchants meet customer expectations of faster delivery. Merchants often operate multiple stores in various locations within their operational area so they need a reliable way to measure their fulfillment performance.
Many reasons contribute to stores delaying and rejecting orders, including low operational strength and inventory shortages. Customer order cancellations are also common. Tracking store fulfillment performance enables retailers to identify and resolve these order fulfillment issues.
Likewise, merchants prefer to keep a company-wide order fulfillment goal for daily processed, shipped, rejected, and canceled orders. Any facility performing below the set goal raises a concern for merchants and puts their focus on improving performance of these facilities.
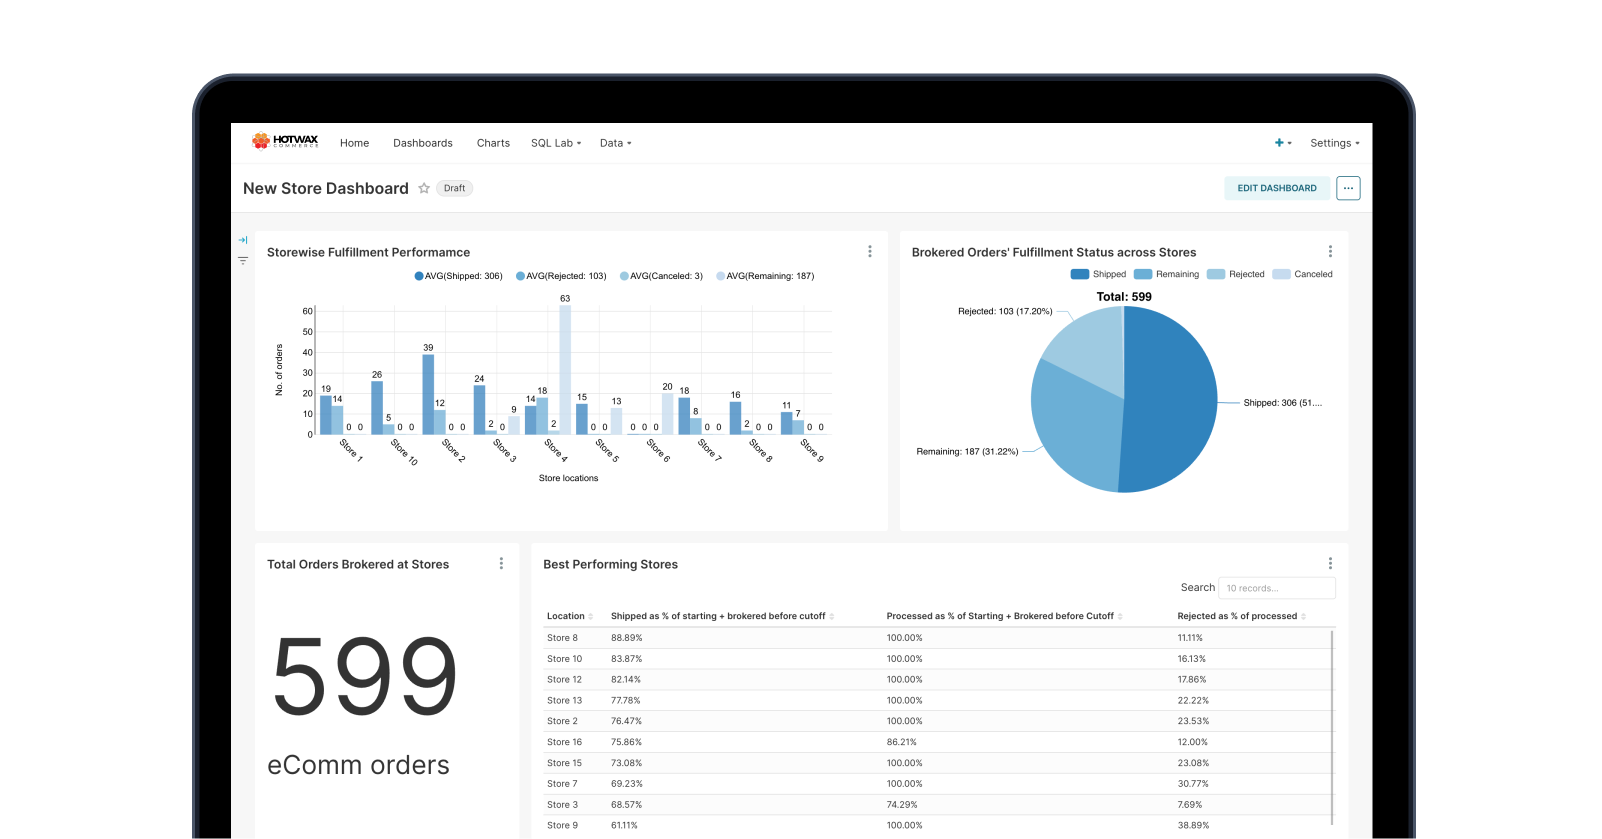
The Store Dashboard shows the storewide data where the orders were brokered, rejected, canceled, and then fulfilled in a day.
The report shows the percentage of shipped, processed, and canceled orders of the stores. Retailers can compare the actual fulfillment performance against the set goal to assess performance of each store.
What the report shows
For each store, the dashboard shows one day of fulfillment activity as percentages, so stores of different sizes can be compared fairly.
- Brokered: the orders routed to the store.
- Fulfilled: the share of those orders the store shipped.
- Rejected: the share the store turned down.
- Canceled: the share that ended in cancellation.
How teams use it
Store and eCommerce leaders compare each store with the company-wide fulfillment goal and focus on the stores that fall below it. A store with a high rejection rate often has inventory counts that do not match what is on the shelf, so a cycle count is a good first step.
Reviewing the dashboard daily makes it easy to spot a store that slips and to see whether a fix brought it back to goal.
The Store Dashboard is one of the pre-configured reports in the HotWax Commerce BI report library, which covers demand and sales, fulfillment, pre-orders, returns, and more.
User
Head of eCommerce, Head of Stores, Vice President of Retail
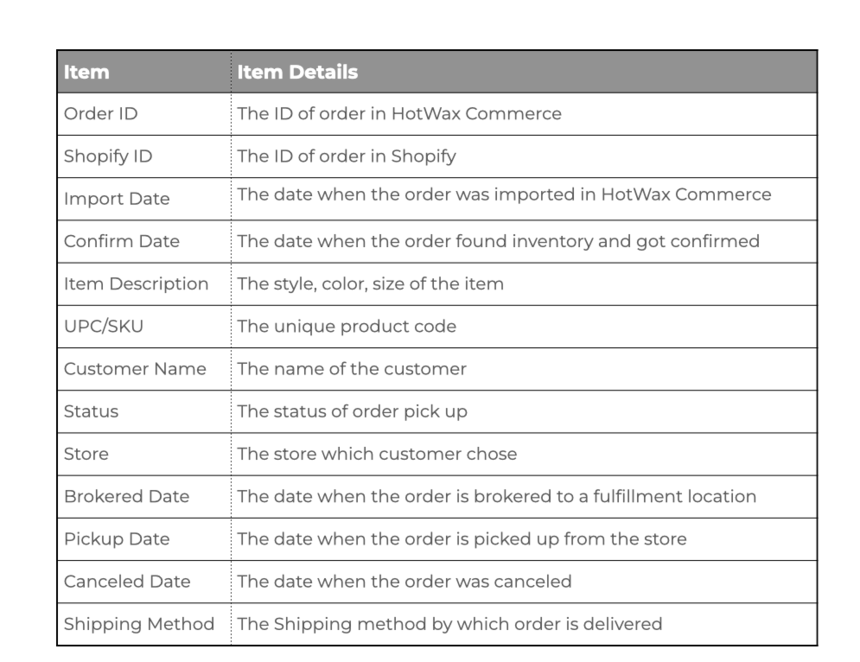
Glossary