
Headquarters
175 S Main St Suite 1310,
Salt Lake City, UT 84111


Blog | Miscellaneous BI Reports
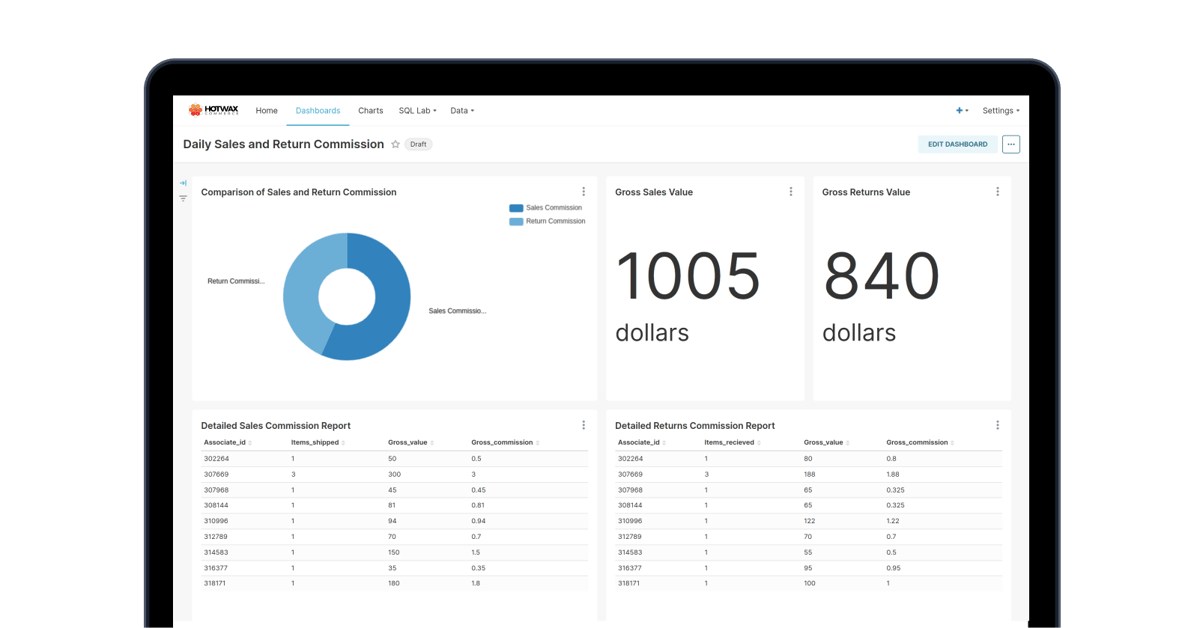
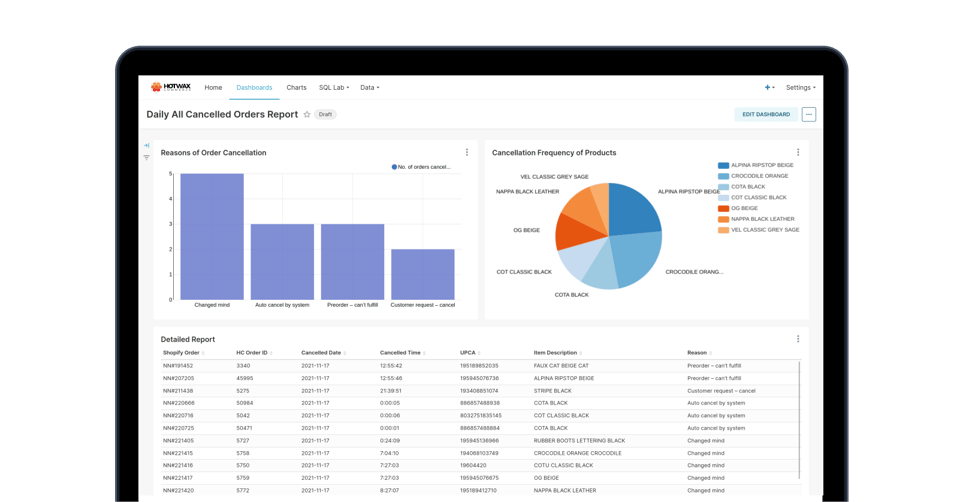
E-commerce retailers invest significant money in attracting and converting customers, but despite their best efforts, or.
Blog | Miscellaneous BI Reports
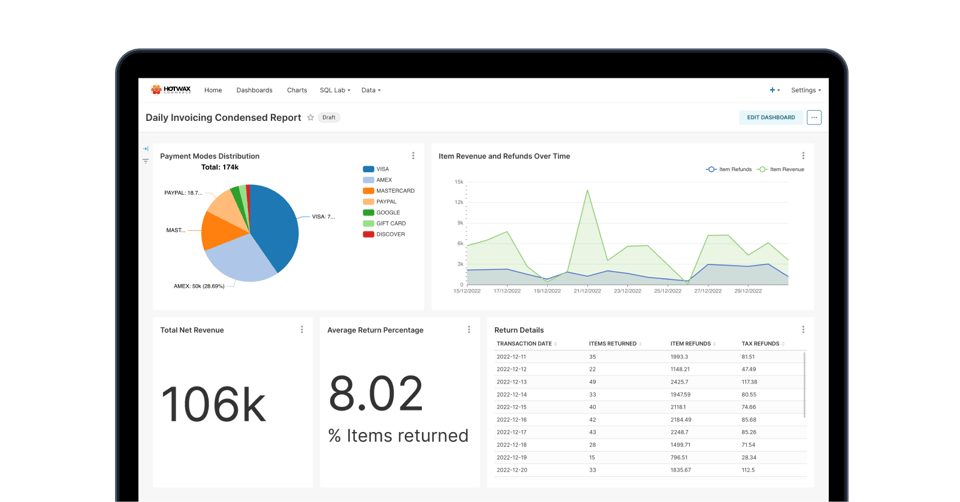
Managing cash inflows and outflows is vital for maintaining a company's financial stability. Analyzing daily financial d.
Blog | Return Reports
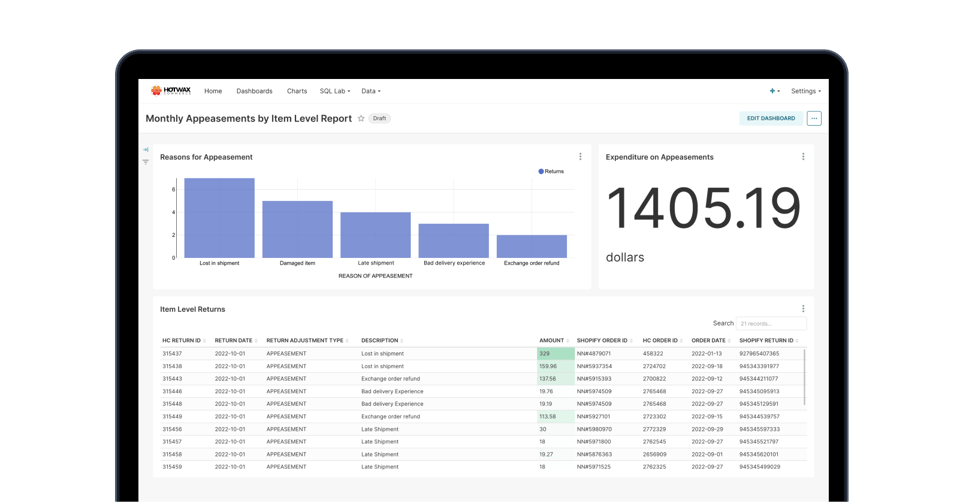
Appeasements occur when a retailer refunds an order without receiving the returned item. When merchants make appeasement.
Blog | Return Reports
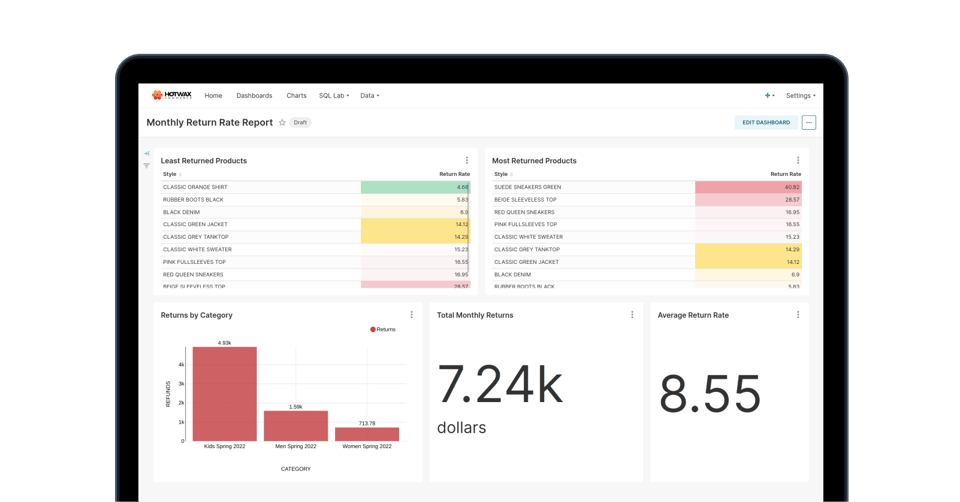
Return requests are placed for a number of reasons, such as customer dissatisfaction, improper fit, or it otherwise does.
Blog | Return Reports
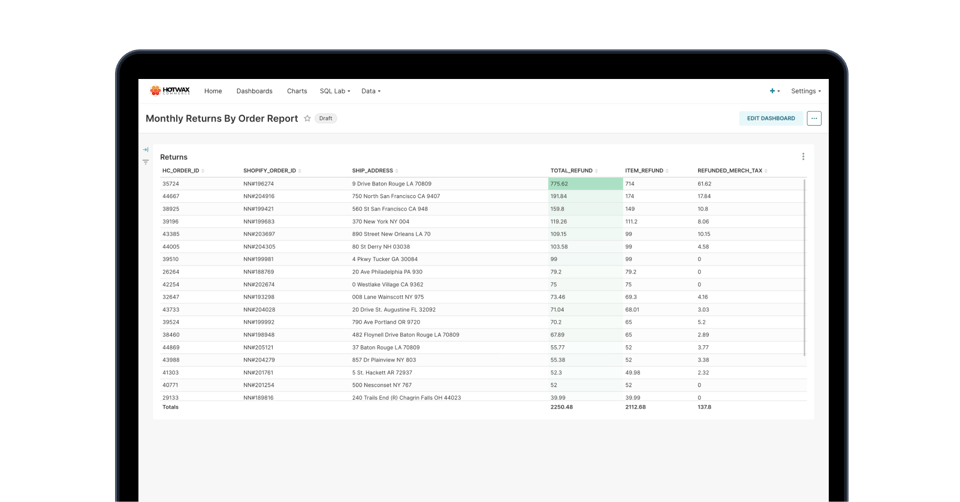
The Monthly Returns by Order Report gives merchants another look into this same dataset. In this view, merchants can vie.
Blog | Return Reports
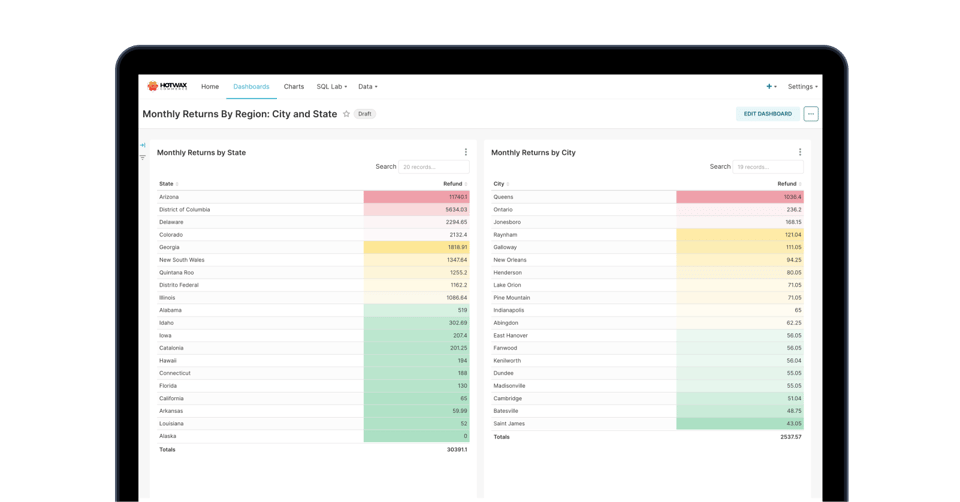
Sometimes, merchants receive more eCommerce returns requests from one region than another. One potential cause of this i.
Blog | Pre-Order Reports
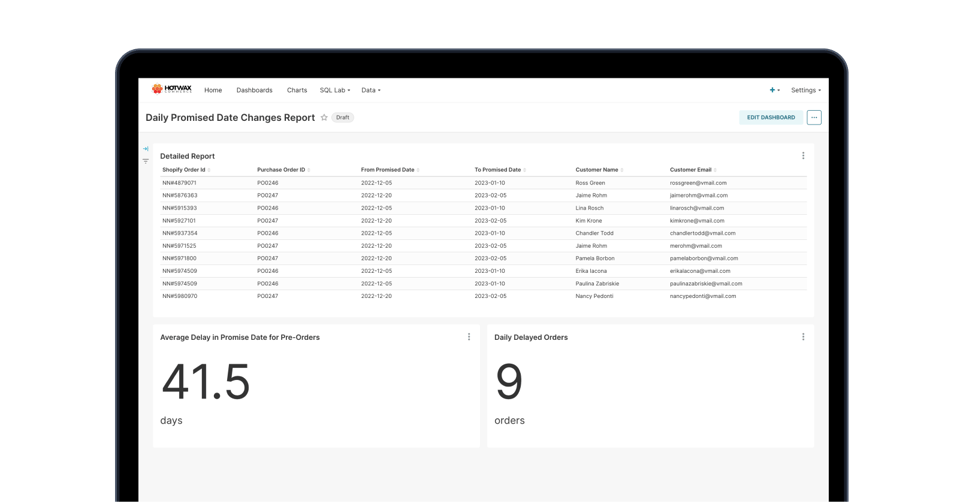
The customer expects their pre-orders to be shipped by/on the promised date. Due to supply-chain constraints or any othe.
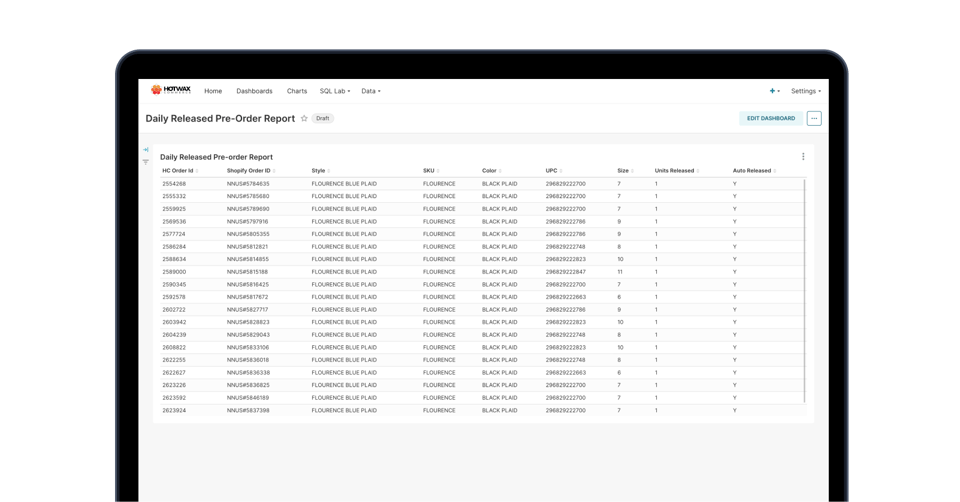
Blog | Pre-Order Reports
When inventory is received at a warehouse, an effective Pre-Order Management System enables merchandisers to allocate in.
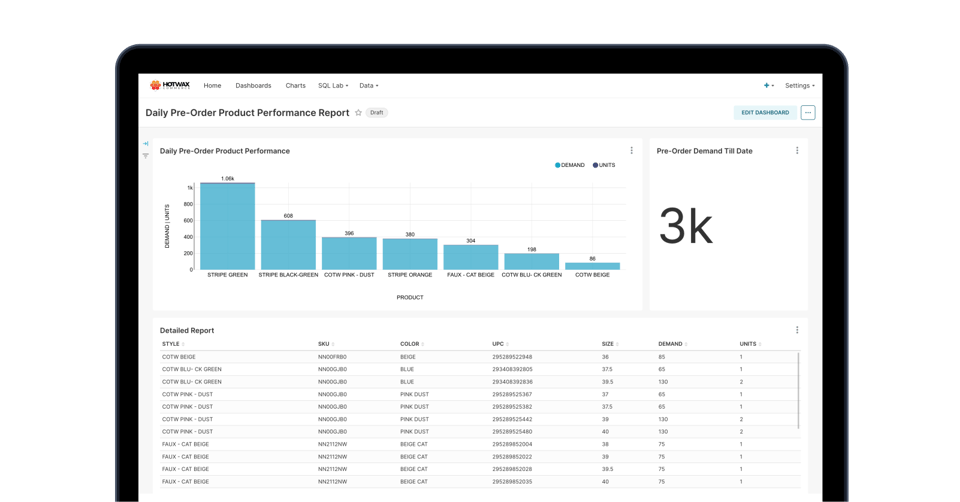
Blog | Pre-Order Reports
Merchandisers want to measure the best and least-performing Pre-Order products to guide their future strategies. For exa.
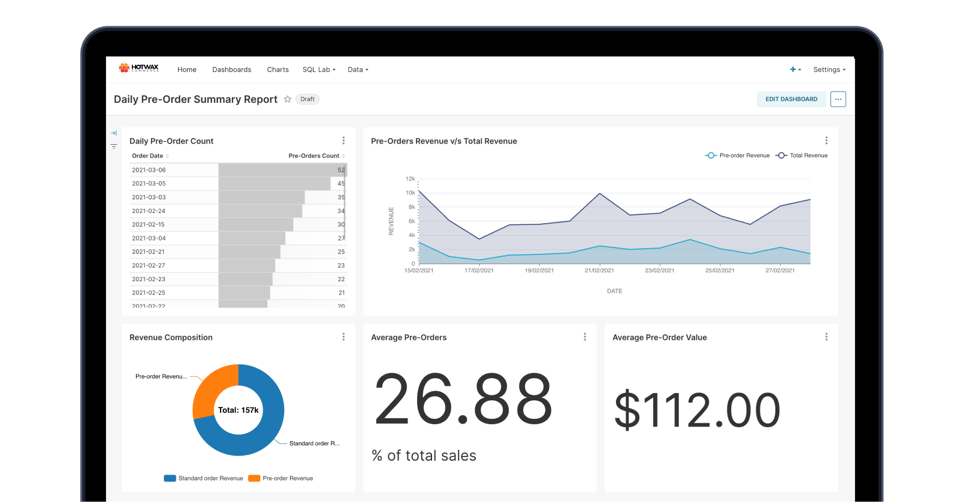
Blog | Pre-Order Reports
Merchants with successful pre-order strategy implemented with the help of a Pre-Order Management System can get up to 10.
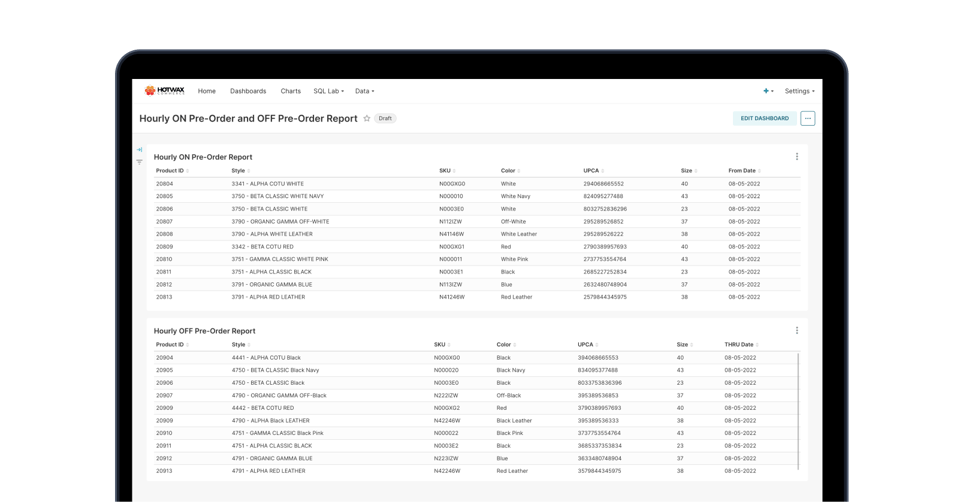
Blog | Pre-Order Reports
A merchandiser wants to determine which items should be available for Pre-Orders based on purchase orders and the queue .
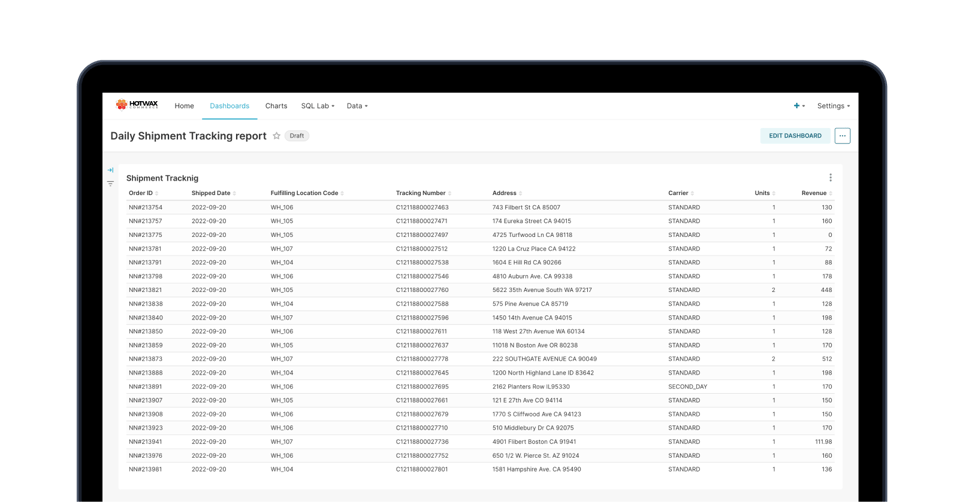
Blog | Fulfillment Reports
Merchants use third-party services to ship orders to customers' addresses. Orders are picked, packed, and handed to thir.
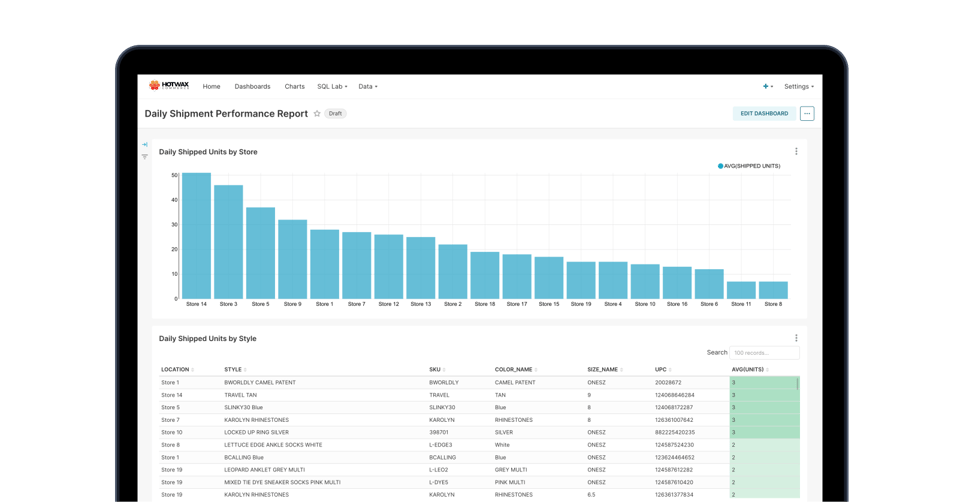
Blog | Fulfillment Reports
Merchants measure their stores’ omnichannel order fulfillment rates and want a clear, accurate view of their daily shipp.
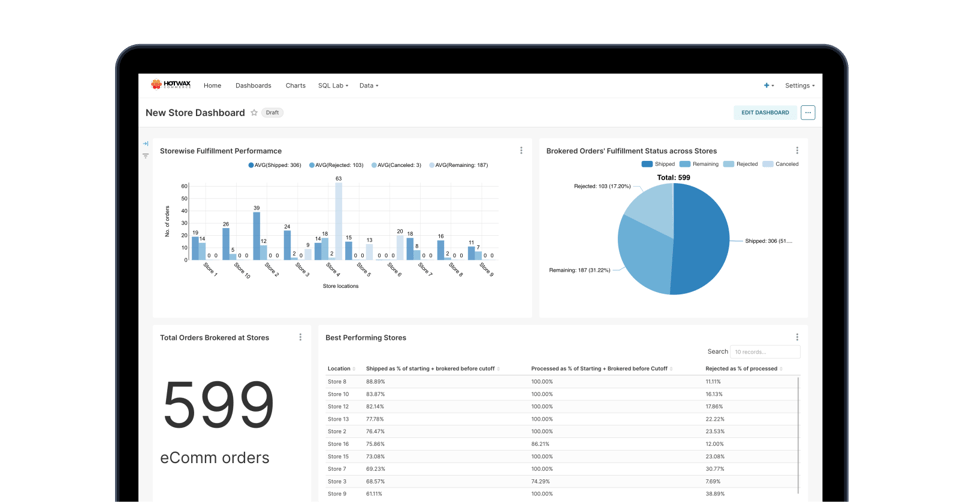
Blog | Fulfillment Reports
Omnichannel retailers use stores as their order fulfillment locations. Fulfillment centers help merchants meet customer .
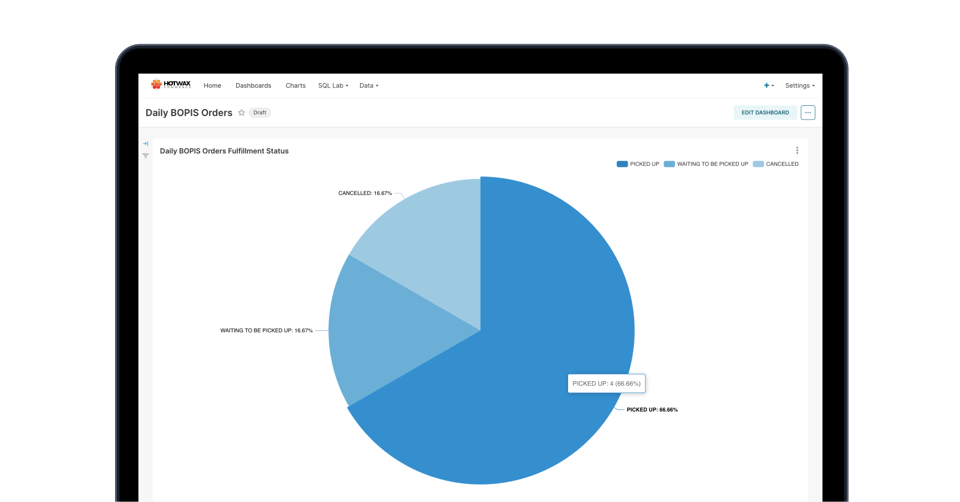
Blog | Fulfillment Reports
Insider reports that 39% of consumers prefer using BOPIS when placing online orders because they get their orders faster.
Blog | Fulfillment Reports
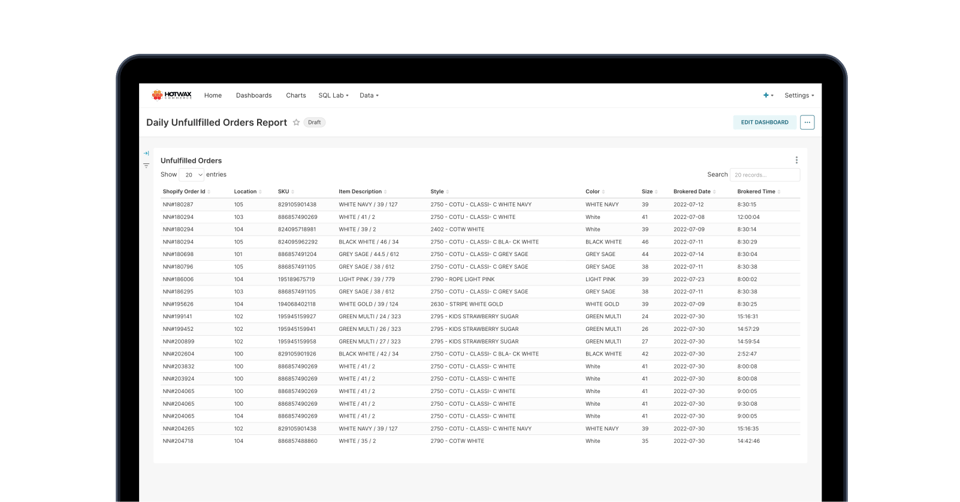
Merchants set benchmarks for fulfilling orders. Generally, merchants intend to complete order fulfillment within a seven.
Blog | Fulfillment Reports
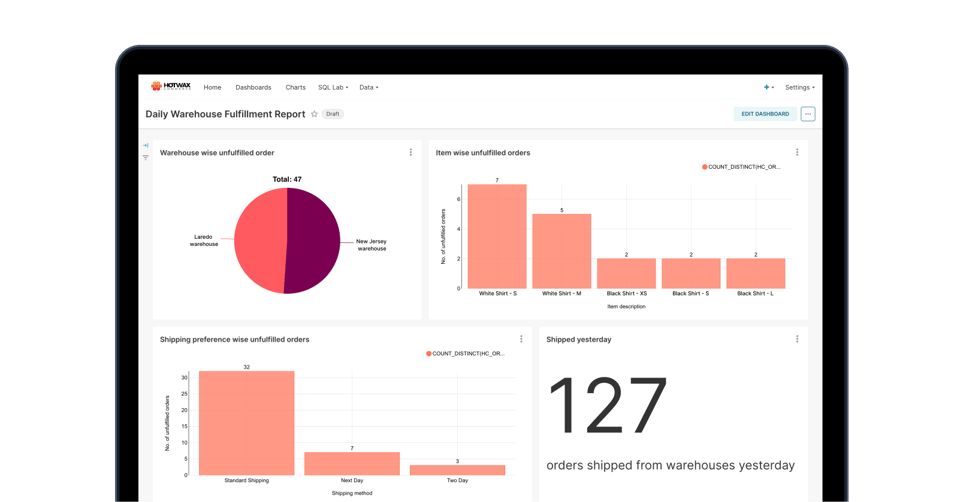
In the era of eCommerce growth, retail warehousing has become increasingly crucial to modern businesses. A fully functio.
Blog | Fulfillment Reports
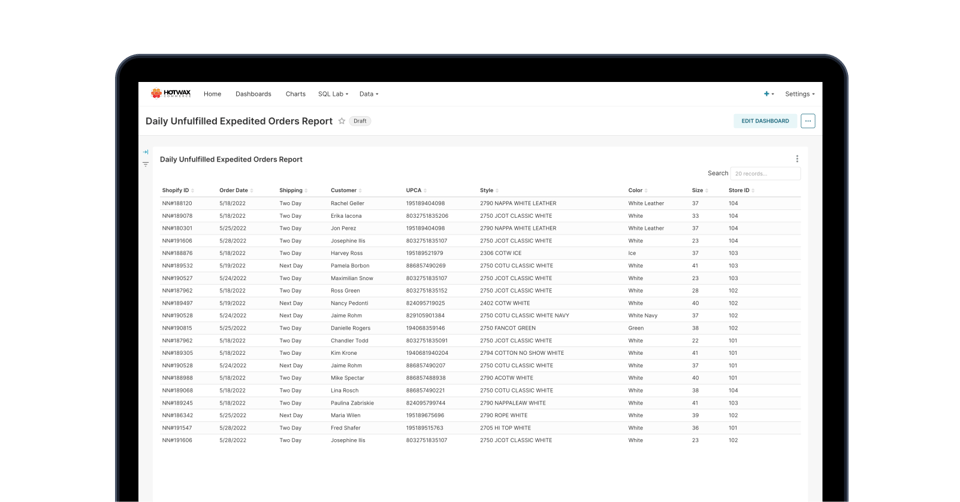
According to the State of Shipping Report, 62% of consumers expect their orders to arrive in less than three business da.
Blog | Demand and Sales Reports
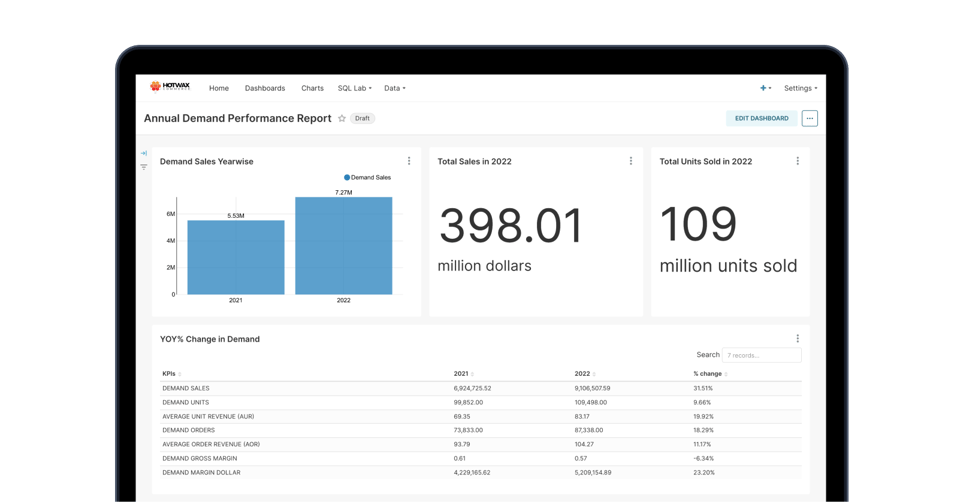
Retailers compare annual demand to determine business growth and decline in demand. For example, if your 2022 Christmas .
Blog | Demand and Sales Reports
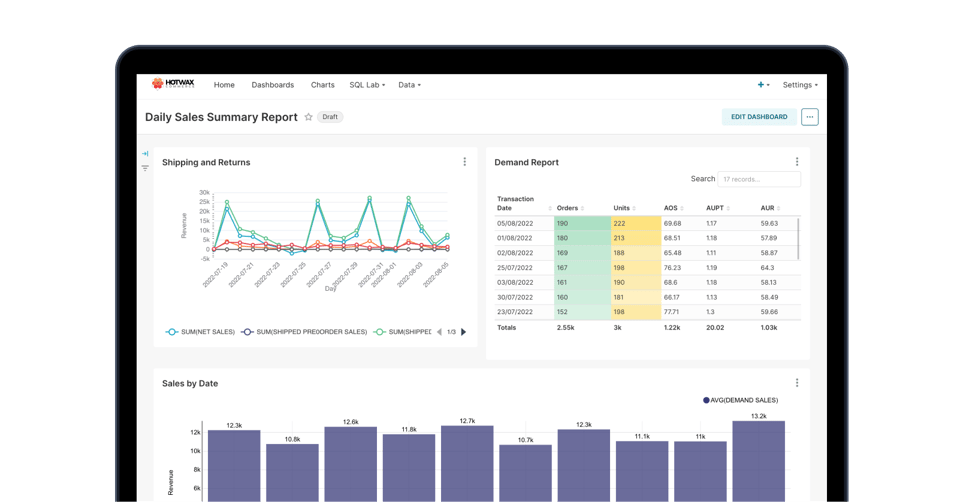
Retailers must continually analyze changes in daily sales revenue and use this information to improve sales strategy and.
Blog | Demand and Sales Reports
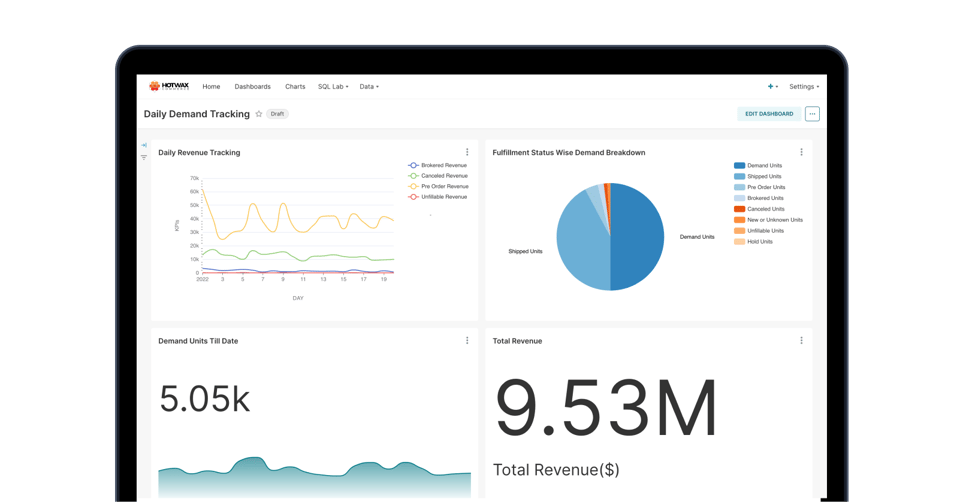
Every day, retail businesses receive a high number of orders. But out of all the orders received, not all orders are ful.
Blog | Demand and Sales Reports
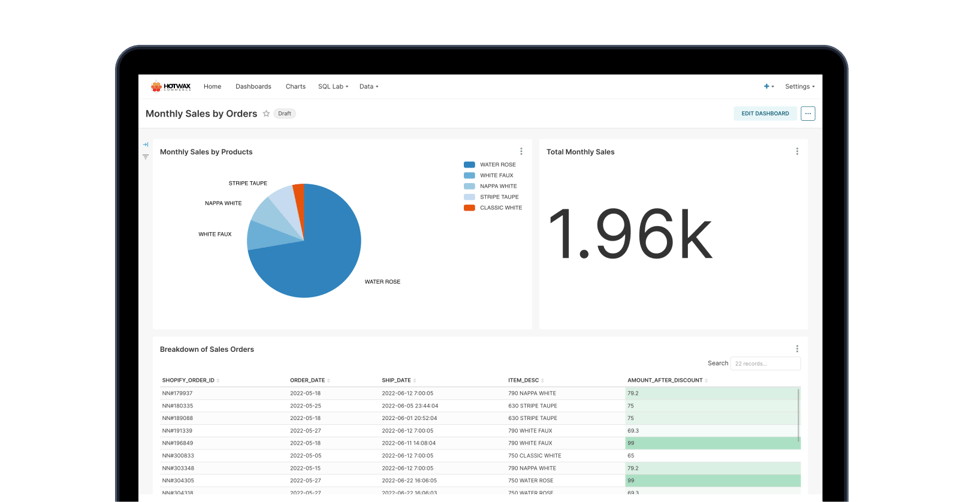
Similar to the Monthly Sales by City and State reports, retailers often need a bird’s eye view of sales by order. Retail.
Blog | Demand and Sales Reports
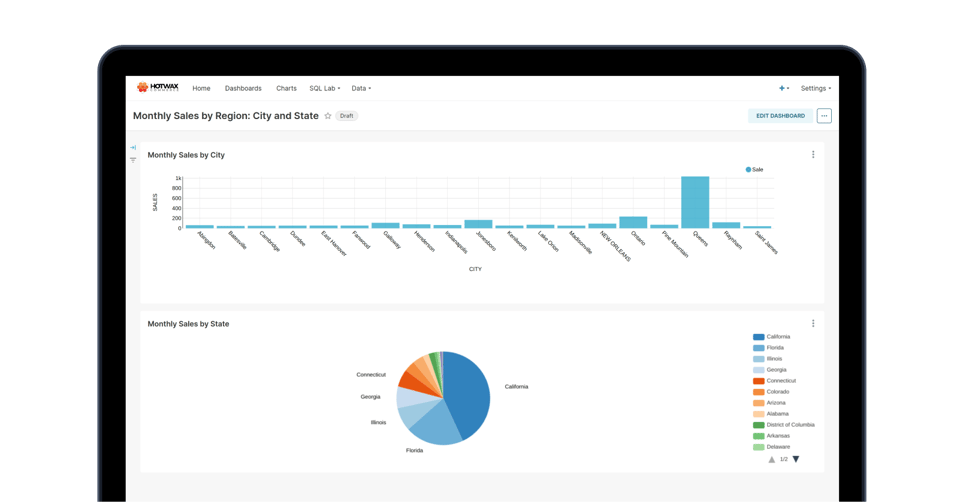
Retailers need a quickly accessible breakdown of the sales contributions made by each geographic region to easily identi.
175 S Main St Suite 1310,
Salt Lake City, UT 84111